Debugging Modules
Once you've started coding, debugging the code will become essential to your success. We consider it important enough that we're covering it here before you dive into the details in the following sections.
There are three main routes to debugging: log through the API, console.log, interactive debugging
Log through the API
Companion provides individual log pages for each module that are different from the main Companion log page.
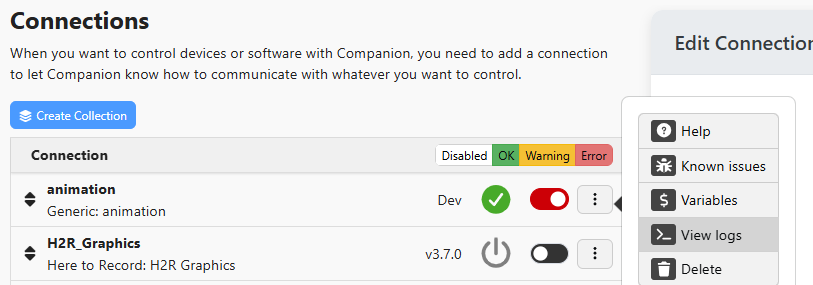
You can open the module-specific log view from the connections page by clicking the ⋮ button and selecting "View logs":
The module InstanceBase class provides a logging function that allows you to specify the log-level as one of: "info", "warn", "error", or "debug". For example:
this.log('debug', 'My debug message.')
These messages will show up in the module-specific log page and can be filtered by selecting/deselecting the "Debug" button (or whichever log-level you chose) in the top-left of the window:
26.01.01 00:00:00 Module: My debug message.
Log to the console
The simplest debugging method is to log to the console.
console.log('your data/message');
These messages will still show up in the module-specific log page and can be filtered by selecting/deselecting the "Console" button in the top-left of the window:
26.01.01 00:00:00 Console: your data/message
Depending on buffering, several console.log() messages may be grouped together, so only the first will appear to have a timestamp. Use the API this.log() function described above, if seeing things reported in exactly the call order is important.
Attach a debugger
Often it can be useful and more convenient to attach a debugger to your module so you can create breakpoints from which you can inspect its state while the module is running. This method also has the advantage of not requiring the addition of numerous logging statements.
To attach to your module's process, first add a file named DEBUG-INSPECT (no suffix) in the root of your module folder. The file can be empty or have a single number in it, which specifies the debugger port number. Next time you start Companion, it will launch your module with the remote debugging protocol enabled.
By default Companion will pick and use a random port that will change each launch, alternatively, you can specify a port number inside the DEBUG-INSPECT file to use a fixed port for debugging.
You can use any compatible debugger such as the built-in VS Code debugger, or Chrome inspector to connect to your process.
It may not be possible to debug the init method from your module with this, Companion still imposes the same launch timeout as usual here. But you can attach after this and see what is going on.
VS Code users can store a setup which allows you to use F5 to initiate debugging as follows:
-
Put a port number in
DEBUG-INSPECT-- for this example it is 12345. -
Put the following into the file
.vscode/launch.json(where the value of "port" matches the value inDEBUG-INSPECT).
{
  "configurations": [
    {
      "name": "Attach to Companion module",
      "port": 12345,
      "request": "attach",
      "skipFiles": ["<node_internals>/**"],
      "type": "node"
    }
  ]
}